The business world is increasingly getting data-driven. Data helps them make decisions about various things, including sales, hiring, goals, and all areas for which an organization has data. However, in raw form, it can be intimidating for businesses to understand that data as they, usually, don’t have a background in statistics or data analytics. To get insights from it, data must be in an easy-to-understand format so that it can be easily communicated to concerned people. Power BI Banking takes out all the hassle of spending hours into drawing insights from raw data.
What is a Power BI?
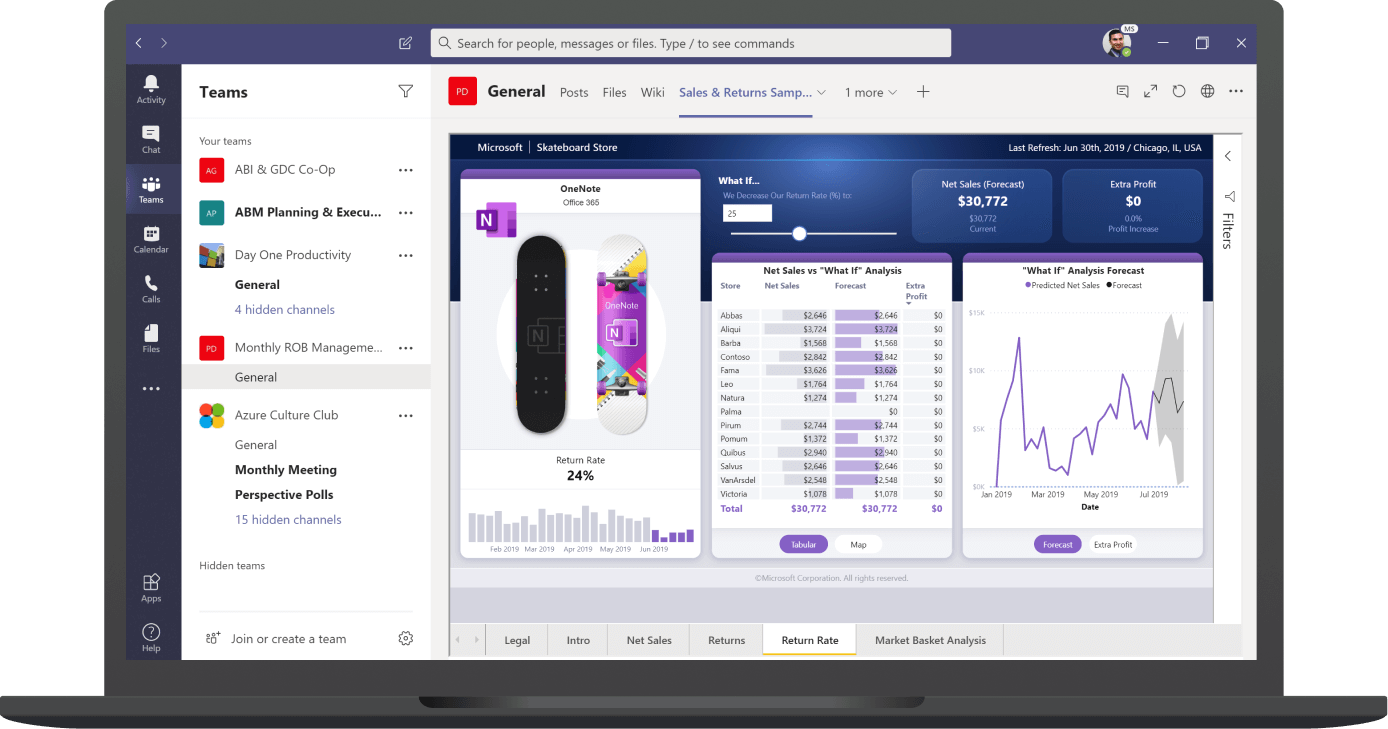
Power BI, a product of Microsoft, is a collection of software services, apps, and connectors that will transform your unrelated sources of data into coherent, visually attractive, and interactive insights that an organization can use. No matter if you manage your data in a Microsoft Excel workbook, a collection of cloud-based and onsite hybrid data warehouses, Power BI allows you to connect to data sources, clean, and organize your data without impact underlying sources. With Power BI, you can easily discover and visualize what is crucial and share that with anyone you need to.
Power BI Banking consists of:
- Microsoft Windows desktop application – Power BI Desktop
- An Online SaaS (Software as a Service) – Power BI Service
- Mobile Power BI apps available on phones as well as tablets
All these three elements are designed in a way so that people create, share, and use insights most effectively.
Different Ways to Visualize Your Data through Power BI
- Area Chart: It includes Basic (Layered) and Stacked charts. The Basic Area chart is based on the line chart with the area between the axis and line filled in.
- Bar and Column Chart: This is the standard way of looking at specific values across various categories.
- Donut Chart: This type of chart is similar to pie charts. It displays the relationship of parts to a whole. Due to its appearance which resembles a donut, it is called a donut chart.
- Gauge Chart: This chart is used to display the current status in the context of the goal.
- KPIs: It stands for Key Performance Indicators. They help you track the progress towards a measurable goal.
- Line Charts: It emphasizes the overall shape of an entire series of values over time.
- Maps: It is used to link categorical and quantitative information along with spatial locations.
Apart from these ways, data can also be represented in various other forms, such as matrix, pie charts, tables, Q&A visuals, treemaps, and waterfall charts. In short, with the help of Power BI service and Power BI Desktop, you can easily create visualizations.
What’s more, Power BI Banking use is safe and secure. Just like other Microsoft services, Power BI is also built on Azure which is Microsoft’s cloud computing infrastructure and platform. So, Power BI also ensures the same level of security as offered by other Microsoft services. Designed for self-service business intelligence, Power BI is an ideal solution for any business to make sure that critical goals are fulfilled.
Image Source: https://powerbi.microsoft.com/
Global iTS is a leading Microsoft Dynamics 365 ERP and CRM Partner with offices all over GCC (Bahrain, Saudi Arabia KSA, Oman “Muscat”, UAE “Dubai”, and Kuwait), with domain expertise in Financial Services Sector Digital Transformation like” Retail Banking, Commercial Banking, Insurance Providers, Private Equity, and Investment Banking.